Smart Demand-Responsive Transport and Paratransit services generate very useful data. This data is essential for adapting the on-demand transport offer to the users’ mobility needs and to the challenges of the territories.
Collecting data in order to better organise the offer and improve services on an ongoing basis
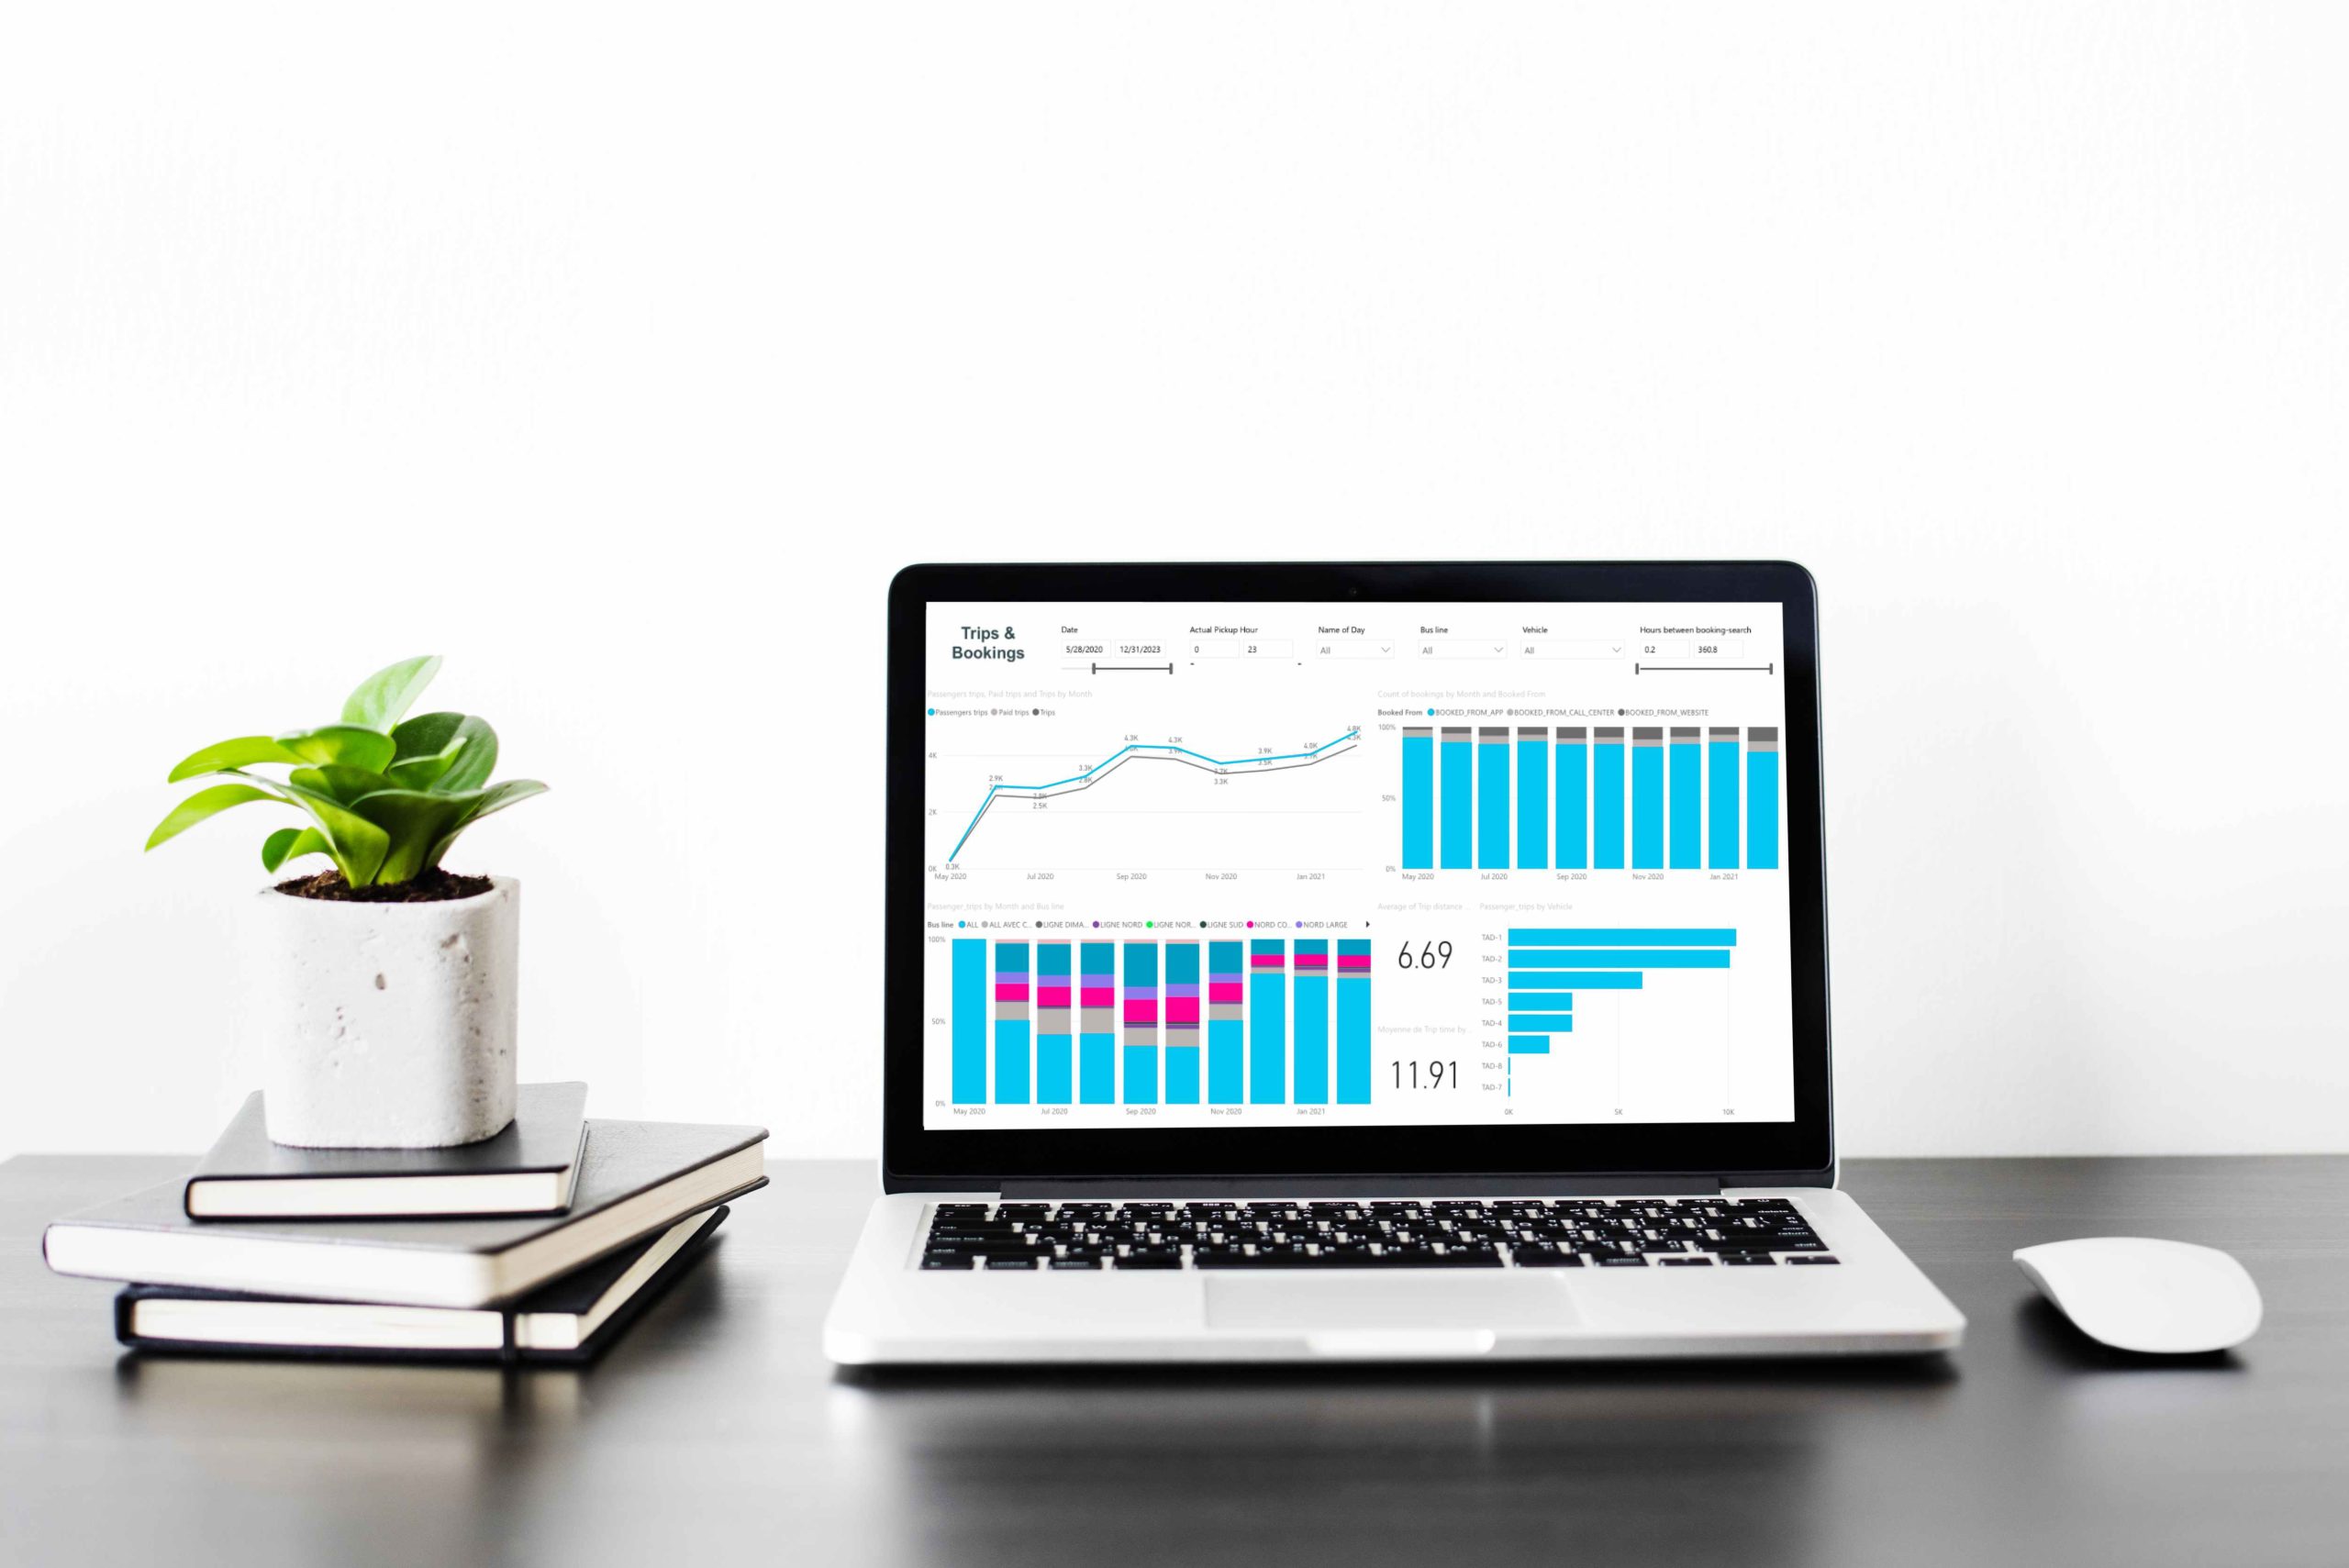
Thanks to a dedicated management interface, transport operators and public authorities of Demand-Responsive Transport and Paratransit services powered by Padam Mobility technology can monitor the operation of their services while visualising the data required for continuous service improvement.
All Padam Mobility services include a turnkey statistical reporting tool. Configured as a continuation of the service launch, it includes tables, graphs and advanced analysis to provide key information on the operation of the service and its use.
The statistical reporting tool takes the form of a dashboard. For each graphical display, it is possible to filter the data display by day, week or month. It is also possible to customise the dashboard by pinning favourite statistical elements.
Demand-Responsive Transport: Which data for which analyses?
The Padam Mobility services’ statistical reporting tool allows to visualise and quickly obtain information through around fifty indicators divided into 13 categories covering all the operations of a DRT or Paratransit service: acquisition, searches, conversion rate, user activity, flows, performance, groupings, vehicle fleet use, punctuality, quality of service, etc.
Focus on 8 categories and their indicators:
Searches: indicators that show the number of trip searches per time slot during the day as well as the number of searches per travel time. These indicators provide useful information on travel uses and needs in a given area.
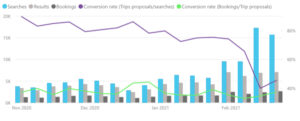
Conversion rate: all indicators relating to the different conversion rates between searches, trip proposals and bookings made. These indicators give a precise idea of the volume of searches leading to a booking and the relevance of the trip proposals made to users.

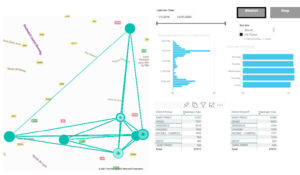
Flows: the reporting tool makes it possible to visualise on a map the flows of DRT or Paratransit trips carried out on the territory according to the filters applied (line, time slots, day of the week, departure or arrival stops).
Performance: indicators for visualising the performance of the DRT or Paratransit service with information on the trips made by the vehicles and the passengers carried. These indicators make it possible to ensure the optimisation of vehicle routes and itineraries.

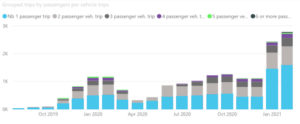
Groupings: indicators providing information on the pooling rates of passengers in vehicles. These indicators help to ensure that vehicle loading is optimised, the keystone of a smart DRT and Paratransit service.
Use of the vehicle fleet: indicators for visualising the use of the fleet of vehicles of the DRT or TPMR service.
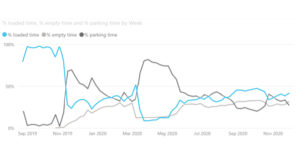
Punctuality: indicators providing information on the punctuality of the service: rate of trips whose duration increases by 10 minutes, average number of delays in minutes in passenger pick-ups and drop-offs, delay duration in minutes, rate of delays in pick-ups and drop-offs, etc.

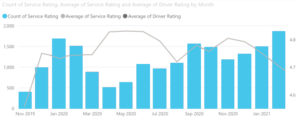
Quality of service: indicators that make it possible to assess the perception of the service by users through the ratings given to the service and the driver.
This article might interest you: Ride booking by phone: facilitating the care of specific populations.
Find out more about Padam Mobility.